Geography 2.0: Virtual Globes

AAG2007 Virtual Globes Logo

Wednesday, March 29, 2006

First information circular: Virtual Globes Scientific Users Conference

Dr. Matt Nolan of the University of Alaska-Fairbanks and EarthSLOT project, has announced the call for abstracts and registration for the Virtual Globes Scientific Users Conference. The three-day conference and workshop will be held at the University of Colorado, Boulder, July 10-12, 2006.

The conference hopes to foster community-building among earth scientists and educators interested in virtual globes technology--including the compilation and dissemination of associated expertise and resources.

The program will be comprised of 15-minute talks, interactive posters, and several plenary invited talks. For the 15-minute talks and posters, abstracts are limited to 500 words.

The conference website, including a link for abstract submission, is: http://www.earthslot.org/vgconference/


At last month's AAG2006 Virtual Globes sessions, I was pleased to have Dr. Nolan participate as an invited panelist. In fact, while I was organizing the AAG activities, he provided me a great deal of helpful guidance, as well as, introductions to many of the technology developers. This upcoming Boulder conference undoubtedly will be quite excellent--particularly for the geoscience and education community.

Tuesday, March 28, 2006

Interact with the eclipse

Here is a step-by-step guide for interacting with the eclipse using the free virtual globes software Celestia:

1) Open Celestia.

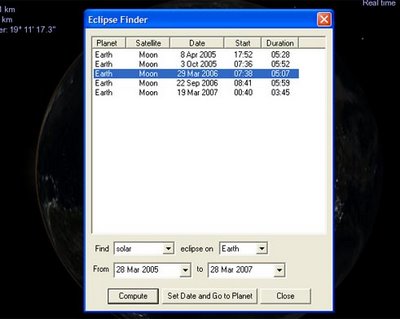
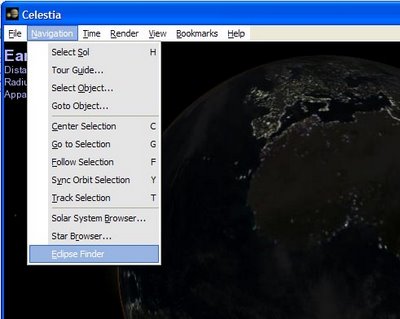
2) Under the Navigation menu, select Eclipse Finder. The Eclipse Finder dialog box will open.


3) When the window opens, click Compute. All the defaults already should be set properly to view a solar eclipse. If not, copy the settings from the screenshot.


4) To select the 29 March 2006 eclipse, move your cursor and click on the line: Earth Moon 29 March 2006 07:38 05:07. The eclipse will be highlighted in blue. Once selected, press the button Set Date and Go to Planet. Alternatively, you can just double click on the eclipse selection.

5) Click the Close button on the dialog box.


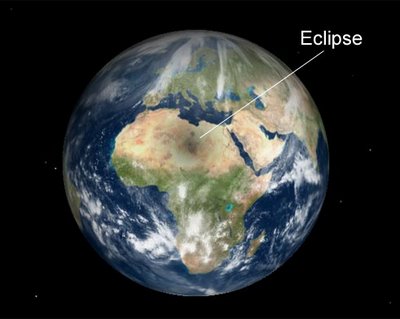
The dark spot in the central Sahara is the eclipse. If you press the letter key "L", it speeds time by an order of magnitude (10X). Press "L" twice--100x faster than real time--and the shadow will track across the planet. Visit Celestia's Time menu for more options. For instance, you can reverse time using the letter key "J".

Use your mouse buttons to navigate and watch the eclipse from other angles.

Friday, March 24, 2006

Imagery updates for Google Earth

Google Earth blog reports several imagery upgrades for Google Earth. The official word is that most of the updates are for Germany. As someone with an affinity for geysers, I have noticed improvements, though arguably minor, for Kamchatka (Russia), Chile, Iceland, and New Zealand--the location of the world's largest geyser fields outside of Yellowstone. These basemap 15-meter resolution areas are now covered by TruEarth imagery.

Here's two files to highlight the imagery upgrades (mostly for my geyser science friends):

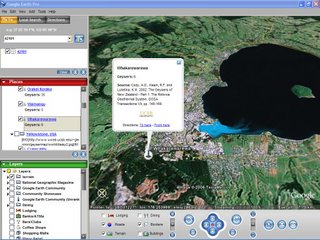
  • My KML of the world's major geyser fields. If you visit Whakarewarewa Geyser Field, Rotorua, New Zealand, notice Sulphur Bay is now visible. It's the turquoise inlet at the southern portion of lake. Several redundant imagery glitches now exist, however, near Orakeikorako. Much of the cloud cover at Kamchatka and Iceland is now gone. The United States' second largest remaining geyser field--Geyser Bight, Umnak Island, Alaska--is now cloud free.

  • My more-detailed KMZ of El Tatio Geysers, Chile-(info page). The area appears to have higher contrast in this newer imagery. There is less bleeding of the overexposed siliceous sinter regions onto adjoining pixels.

Whakarewarewa with Sulphur Bay visible

Wednesday, March 22, 2006

Data: everything, everywhere

The article in Nature (23Mar06 issue), 2020 Computing: Everything, Everywhere by Declan Butler, discusses the proliferation of sensor networks and the expected, building data flood. An important issue only briefly mentioned in the otherwise excellent article is the need to handle vast amounts of data and produce meaningful products. Infinite data are often similar to no data at all. In fact, so much data already are created and collected, that many are effectively discarded. In a talk at the University of California San Diego, Google Earth's Chief Technical Officer Michael Jones described conversations with NASA on their vast planetary imagery library; most is not used or visualized, but simply stored. The challenge is to not simply create, but to organize and archive data in a meaningful way. The solution--possibly invisible to the human user--requires a metadata infrastructure where specific queries by both humans and computers can parse input.

Elsewhere in the same Nature issue, a commentary entitled 2020 Computing: Exceeding Human Limits, Stephen Muggleton outlines some of the issues associated with automation and vast amounts of data.

At UCSB, we have several scientists interested in "Digital Earth." Digital Earth was defined by Gore in 1999 as a "multi-resolution, three-dimensional representation of the planet, into which we can embed vast quantities of geo-referenced data." Digital Earth could also be defined by Butler's article title, "Everything, Everywhere." Most agree that despite progress in data creation and virtual globes technology, Digital Earth does not yet exist. Until recently, I would have said mechanisms for adequate visualization were missing; Google Earth, ArcGIS Explorer, and other virtual globes have largely alleviated that issue. Now, perhaps the most-significant challenge is looming. In my view, the reason Digital Earth has not come to fruition is because we are missing the set of algorithms to associate uncontexualized data and concepts with space and time. Consider the volumes within a library. A vast amount of unusable data exist within the bookshelves--even if the volumes were digitized. The problem is how to associate the various internal references to one another and to concepts, then how to create from these results appropriate representation within space-time. Approaching similar issues is the subject of at least two ongoing UCSB geography dissertations.

Finding solutions for metadata, context algorithms, data mining, and spatiotemporal representation is not the exclusive purview of Google, Microsoft, and the private sector. Nor are these problems unrealized by other scientists; for instance, the recent report, Priorities for GEOINT Research at the National Geospatial-Intelligence Agency, discusses several of these questions, including data proliferation, mining, and visualization--all hold particular relevance to spatial scientists. Such data issues are general, and faced by all interests of a computing-based, science-driven society. Geographers should equip for the challenge.

Tuesday, March 21, 2006

Since I haven't mentioned SketchUp

Since I did not even mention Google's acquisition of SketchUp when it happened a week or so ago, I thought I should at least acknowledge it. There's been quite a bit of speculation and analysis of the purchase; here's the latest from Directions Magazine (21Mar06).

In mid-February, I had the pleasure of having coffee with a prominent AEC businessperson. As we discussed various strategies and tools for 3D modeling, the conversation led to SketchUp's Google Earth plugin. I remember their question/statement, "Have you visited SketchUp lately? They are Google."

Monday, March 20, 2006

NASA World Wind road map

For those interested in the release dates and expected functionality of the next NASA World Wind version, check out the "World Wind Wiki Road Map" page.

According to the site, v.1.3.4 is expected in April. The developers will skip v1.4, and v1.5 will be released in September/October 2006. The road map enumerates several of v.1.3.4 features, including: 1) the ability to refresh elements in a layer, 2) improved implementation of shapefiles, 3) elevation data will include ocean bathymetry, 4) Mars and Venus datasets will be available--users will be able to access ten different Mars datasets, and 5) Sloan Digital Sky Survey SkyServer imagery will be accessible.

Version 1.5 will be implemented in .NET and Java, with an API-centric core. As such, the developers plan for the software to be accessible within users' web browsers.

The blog Bull's rambles, by a NASA World Wind contributor and forum moderator, reports that NASA has "hired Tom Gaskins to spec out 1.5 and lead the java team, also SUN have said they will hire a developer to help. The C# version will continue to be lead by Chris [Maxwell] and most of the current OS devs seem likely to stick with him."

By the way, I did a quick download check on sourceforge.net. Over the past month, NASA World Wind was downloaded about 11,000 times per day; during 30 days in late February-early March, there were approximately 330,000 downloads (~30TB).

Conversations with maps

While watching the video of the AAG2006 virtual globes sessions, I heard Microsoft's Tim McGrath mention the ability to share and manipulate maps within MSN Messenger. Actually, McGrath used a phrase like "users can have a map tug of war." I went online to try it out, but unfortunately, none of my contacts were online. For readers with friends, this 30Sep05 MS Live Local blog entry describes how to share and manipulate maps using MSN Messenger.

Not to be thwarted, I did a websearch for the terms "map", "shared", and "chat". In the results, I found an AJAX/Google Local implementation from midnightcoders.net. The site allows shared map manipulation during chat, but I was the only site visitor.

Last, I noticed that a somewhat similar site, mapable.com, recently went live. Mapable allows users to create georeferenced chatrooms. The mapable chatroom does not allow shared map manipulation; the site geolocates users, posts a marker at their location, and their chat messages appear next to their markers. For an example, you can visit the site, or a test I created here.

chatroom from mapable.com


I will withhold substantial analysis of these conversations with maps, other than the following few sentences. The primary purpose of maps is to encode and communicate spatial data; the ability for multiple users to interactively manipulate and share geographic information in real time is a powerful form of communication. Given similar functionality in virtual globes, I can imagine: taking a classroom of students on an interactive virtual excursion to Yellowstone; discussing site location and decisionmaking among widely-spread builders, suppliers, planners, and stakeholders; scientists meeting online to examine the evolution of hurricanes; and dispatchers and field personnel allocating and placing resources, in precise, possibly non-geocoded locations, during an emergency.

Friday, March 17, 2006

NASA World Wind at CalGIS

NASA World Wind Project Manager Patrick Hogan will be presenting a talk entitled "NASA World Wind Technology Geospatial Data Management Tool as Applied to California" at the CalGIS conference (Location: Fess Parker Doubletree Inn - Santa Cruz Room, Santa Barbara, California; Time: Wednesday, April 5, 2006, 3:30-5:00pm).

Thursday, March 16, 2006

Microsoft statement about Vexcel

I just received the following statement via email from a Microsoft spokesman:

Microsoft has entered into an agreement with Vexcel Corporation to acquire the company. The agreement requires regulatory approval in the United States and in certain EU countries (Germany and Italy). More details will be available once the deal is closed.

The acquisition is part of Microsoft’s exciting vision to deliver a dynamic, immersive digital representation of the real world that provides the best local search and mapping experience to consumers, businesses and government. Vexcel’s people, products, and services will play a key role in helping Microsoft deliver on this vision.

My previous post provides a few sentences on the relevance of the acquisition to Microsoft's mapping endeavors.

Microsoft acquiring Vexcel

Tracking down an acquisition rumor (see last sentence of earlier post), I called Vexcel. On March 16 (noon Pacific), the operator answered, "Microsoft Corporation". I told the operator I was trying to reach Vexcel, and she confirmed that I had dialed the correct number. The operator forwarded me to marketing, but I was greeted with a "mailbox full" message. It's not 100% confirmation, but it certainly begins to substantiate the rumor. [updated: acquisition in progress confirmed by Microsoft, see latest post]

So, what does Vexcel offer Microsoft? Vexcel provides hardware, software, and services related to aerial and satellite imagery--particularly photogrammetry. With Vexcel, Microsoft has additional expertise and capabilities in extracting information, and creating data, from Microsoft/GeoEye's large catalog of overhead imagery.

Blogging about AAG virtual globes

I have received numerous positive emails about the AAG2006 virtual globes session. Thanks to everyone who participated and attended. After I have a chance to meet with my co-organizer and review the video, we'll post our impressions. For now, several blogs mention the activities:


On an unrelated subject, I heard a rumor about Vexcel. ...more about that as things develop...

Monday, March 06, 2006

ESRI virtual globes reception

Attendees to the Association of American Geographers meeting are invited to a reception sponsored by ESRI, on Thursday, March 9. The ESRI reception will follow the virtual globes panel, so we expect the reception to start at ~6:30-6:45pm. ESRI is providing hors d'oeuvres and drinks. In fact, ESRI has done it right...they are providing heavy hors d'oeuvres and an open bar! Place: Palmer House Hilton Crystal Room. The reception will last about an hour, and the open bar closes at 7:45pm. Come take the opportunity to chat with the panelists and others interested in virtual globes technology.

We'd like to thank ESRI for all the support of the AAG2006 Virtual Globes activities!

At 7:45pm--immediately following the reception--you are invited to stick around the Crystal Room for virtual globe demonstrations by NASA and EarthSLOT. The demonstrations will be led by Tom Gaskins, Director of Learning Technologies for NASA, and Matt Nolan, leader of the EarthSLOT project (a virtual globe built upon Skyline technology and designed for research and education).

Sunday, March 05, 2006

Globes logo

Per request, I have placed a higher-resolution version of the AAG2006: Virtual Globes logo online. It is available here (123K/jpg).

Friday, March 03, 2006

Cartography in ArcGIS 9.2 (karst watershed case study)

Though not on virtual globes, this is a "related" topic. James Fee mentioned ESRI's new cartography tools for ArcGIS 9.2 (see: post), and I wanted to point out an AAG presentation in one week that may be of interest. Rhonda Glennon of ESRI will be discussing several of the new cartography tools at a presentation entitled Karst watershed cartography within ArcGIS. Time and Place: Friday, March 10, 2006, 8:40a.m., Sandburg 8 Room, Palmer House Hotel, Chicago, USA. The abstract can be found here.

For information on other AAG2006 cave and karst sessions, visit aagkarst.blogspot.com.

NGA Research Priorities

I received the following email from Dr. Keith Clarke:

The report [Priorities for GEOINT Research at the National Geospatial-Intelligence Agency] is no longer embargoed, and is now publicly available in pre-release form at the following web site:

http://www.nap.edu/catalog/11601.html


I--Alan Glennon--haven't had time to read the report yet, but did skim the executive summary. The report defines the agency's top challenges for geospatial intelligence, and the body of the report describes some strategies to address those issues. These "hard problems" include,


  • Achieve Persistent Tasking, Processing, Exploitation and Dissemination(TPED)

  • Compress Timeline

  • Exploit all forms of imagery (and intelligence)

  • Share with coalition forces, partners, and communities at large

  • Support Homeland Security

  • Promote horizontal integration


From a GIScience perspective, the sub-problems and recommendations are where the report gets good. There is discussion of spatio-temporal database management systems, spatio-temporal data mining, visualization, grid computing for geospatial data, image data fusion across space/time/spectrum/scale, detection of moving objects from disparate data sources, and geospatial ontology.


Microsoft Windows Live Local Preview (link)

Since I've been busy and haven't mentioned it, I thought I would here. Their tech preview shows a split screen map: on top, a egocentric view of a street; on the bottom, a 2D map that includes an locator icon and its viewing direction. Our "Cognitive Issues in GIScience" class at UCSB discussed it last night. While there was a great deal of criticism regarding its current applicability as an in-car navigation system--navigation was the day's class topic. I asserted that seeing the actual building face of a destination address--and the route itself--was powerful. Anyway, there were better points made, and hopefully, others and myself can discuss them further in the future. The MSDN Channel 9 has a related video (link). They claim 10 million images are being used for Seattle alone.


Time for Google Earth

Also while I've been preparing for AAG and Ireland, I was excited to see Ogle Earth and Declan Butler report about a Creare Inc's development of an initial time-browser for Google Earth. Follow their links for further information.