Geography 2.0: Virtual Globes

AAG2007 Virtual Globes Logo

Friday, June 30, 2006

Virtual Globes Conference only ten days away

I just read the Virtual Globes Scientific Conference agenda, and it looks like a fine program: a day of introductory talks on software, a day of user talks with a panel, and a third day of tutorial/demonstrations. The conference, organized by the Matt Nolan and the EarthSLOT team, will be held July 10-12, in Boulder, Colorado. See the schedule and get details at the conference website.

Since no one in our UCSB globes group will be able to attend, hopefully we'll receive a full report from a geoblogger or other attendee!

On an unrelated note, UCSB Geography just announced the hire of Dr. Martin Raubal to the faculty -- a fine addition to the GIScience program.

Wednesday, June 28, 2006

Mobile phone tricorder

This is the New York Times article that seems to be floating around a lot today: geo-enabled mobile phones with attribute information about their location (article here).

[update 28Jun06, 1915Pacific: Yuk! The NY Times website just changed the access so you have to register to read the article. It's free, but highly inconvenient.]

AAG 2007 Virtual Globes

I just got the First Call for Papers for the 2007 AAG Annual Meeting in San Francisco, April 17-21, 2007. Let's put some virtual globes / mashups / neogeog sessions together!

Since it's right down the road from Silicon Valley, it's a prime opportunity to infuse a techgeek vibe into AAG. Contact me if you have ideas.

Tuesday, June 20, 2006

Comments on naive geography, part 2

For Dan Montello's Cognitive Issues in GIScience class here at UCSB, I was asked to write two short essays, "for and against" the use of naive geography in geospatial software design. Normally, such essays would disappear into an archive on my hard drive, but since virtual globes are referenced a few times, I thought I'd post them.


Comments Against Naive Geography
by Alan Glennon

Egenhofer and Mark (1995) assert that incorporating naive or lay conceptions of geography into GIS and cartographic product design can make spatial information and decision support more accessible to a larger user community. While there is validity to the concept of creating understandable GIS and cartographic products, Egenhofer and Mark do not discuss the perils associated with their design philosophy. At least three prominent risks can be associated with integrating naive geography elements into software and cartographic products, including reductive bias, functionality dissonance, and lessened user control. Such issues make the concept of naive geography inappropriate for use in GIS design.

Reductive bias
Reductive bias describes people’s affinity to construct overly simplistic understandings and categories (Feltovich et al. 1989). Egenhofer and Mark (1995) recognize that people’s lay knowledge “may be contrary to objective observations in the real, physical world.” Many of the naive geographic elements that possess inherent error result from reductive bias. For instance, Egenhofer and Mark provide the example that people, in a “common simplification” of geographic space, generally disregard the curvature of the Earth. They also assert that people generally perceive the world as two-dimensional without verticality, thus leading to overestimating of steepness of slopes and depths of canyons compared to their widths. It is perplexing therefore that Egenhofer and Mark assert that “there is a need to incorporate naive geographic knowledge and reasoning into GISs,” when they acknowledge that such knowledge “may actually contain ‘errors’” and “occasionally be inconsistent.” While they undoubtedly intend for such misconceptions eventually to be remedied, facilitating and acquiescing to erroneous conceptual models would serve only to confuse and perpetuate further misconceptions. Once created, reductive-influenced conceptual models are difficult to correct and overcome (Feltovich et al. 2001). Further, when confronted with evidence contrary to expectations, such as when a GIS yields an unexpected answer to a query, people often rationalize their beliefs without fundamentally altering them (Feltovich et al. 2004). With respect to the naive geography elements that possess reductive bias, Egenhofer and Mark’s design philosophy involves large risks that are counterproductive to geographic understanding and should not be included in a GIS.

Functionality dissonance
Egenhofer and Mark offer naive geography as “the basis for the design of intelligent GISs that will act and respond as a person would” (Egenhofer and Mark 1995). Developing such intelligent GIS technology risks creating unrealistic expectations and misunderstandings about the abilities of computer software (Swartz 2003). Both of these problems stem from functionality dissonance—a phrase modified from the computer science and artificial intelligence issue anthropomorphic dissonance. Functionality dissonance refers to the gap between user expectations and actual software abilities (Watt 1998). As software appears to become more intelligent, users create increased expectations about functionality (Swartz 2003). As the gap widens, so does disappointment, frustration, and dissatisfaction (Swartz 2003).  Further, Schneiderman (1998) argues that behaviors that attribute autonomy to a computer “can deceive, confuse, and mislead users.” Similar to concerns in the artificial intelligence literature, naive geography may cause people to develop “an erroneous model of how computers work and what their capabilities are” (Schneiderman 1998). Since GISs exists as a tight coupling of spatial data, analysis, and visualization technology, such intelligent software may create incorrect conceptual models of each of these components. The recent advent of the spatial software called 
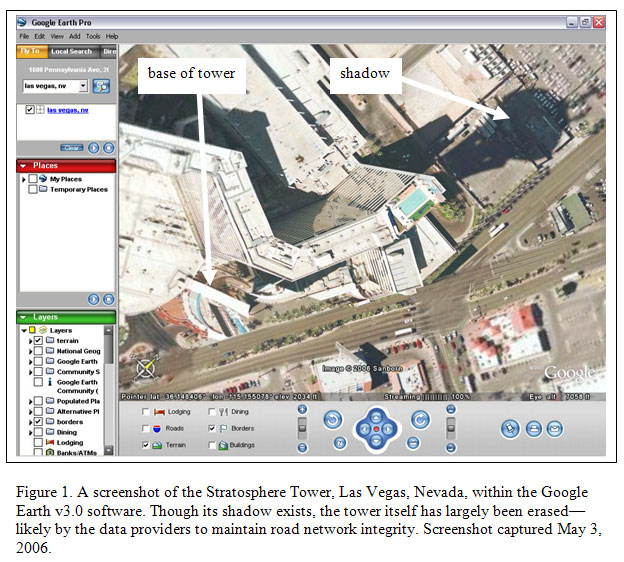
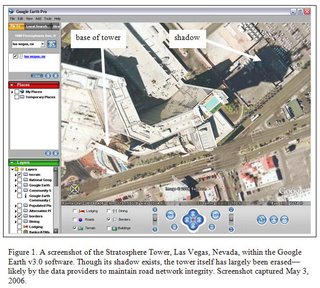
virtual globes provides a relevant example. Virtual globes software allows users to interact with and query overhead imagery and spatial data on a three-dimensional representation of Earth (Butler 2006). The sophisticated technology has given rise to misconceptions about the software’s data, analysis, and output capabilities. For instance, virtual globe imagery sometimes is manipulated without explanation by the software for cartographic reasons (Figure 1). Since the imagery looks “real,” unexpected results may be difficult to mentally reconcile. These misconceptions are exacerbated by the ambiguity of the realities of the software’s capabilities. For instance, the software generally does not offer imagery in real time, but has the capability to do so. Users might also expect the software to possess sophisticated GIS functionality, but only basic tools are offered. In fact, algorithms for performing GIS operations on spheres and ellipsoids largely do not exist (Goodchild 2005). While such failings are research opportunities for academics, lay users may formulate misconceptions of geographic space based on interpretation of stylishly represented, but erroneous spatial data.


Lessened user control
Egenhofer and Mark (1995) offer that “naive geography is also the basis of the design of intelligent GISs that will act and respond as a person would…” As such, the naive geography design philosophy faces similar challenges to those posed by user interface agents—a computer science term for intelligent software assistance. User interface agents are programs that help users to “to achieve the best outcome or, when there is uncertainty, the best expected outcome” (Russell and Norvig 2003, p.4). A prominent example of user agent technology, Clippy the Paperclip, highlights the problems of designing software to predict user needs. Introduced for Microsoft Office in 1997, the cartoon paperclip would appear and open a window with contextually sensitive help based on user actions (Swartz 2003). For instance, in Microsoft Word, if a user began typing a salutation, like “Dear Chris,” the cartoon Clippy would appear and offer assistance in formatting a letter. The problems of such intelligent software assistance include making users feel out of control and lowering self-reliance (Swartz 2003). Quintanar et al. (1982) found that with such help, students felt less responsible for their performance. Swartz (2003) also describes the case that many expert users experienced irritation as a result of the unsolicited user agent assistance; in fact, due to widespread user dissatisfaction with the agent software, Microsoft disabled Clippy in subsequent versions of their Microsoft Office software.

By having the computer lead, users become less involved in the logic and flow of the software’s problem solving. Unlike word processing, working with GIS often includes exploratory problem solving, non-task specific use, and experimentation. Besides the potential for innovation, these unconventional operations shape user concepts of geographic space. Since common sense pragmatism usually conflicts with freeform imagination, the naive geography design philosophy would hinder creative GIS uses.

Counter to Egenhofer and Mark’s (1995) goal of “empowering people” through having “GIS act and respond as a person would,” naive geography design risks encouraging erroneous concepts of geographic space, frustrating and alienating users, and lessening user control of GIS software.

References

Butler, D. 2006. Virtual globes: the web-wide world. Nature, 439(7078): 776-778.

Egenhofer, M. and D. Mark. 1995. Naive geography. In Spatial Information Theory: a theoretical basis for GIS, volume 988 of Lecture Notes in Computer Science, ed. A. Frank and W. Kuhn, 1-16. Berlin: Springer-Verlag.

Feltovich, P., R. Coulson, and R. Spiro. 2001. Learners (Mis)understanding of important and difficult concepts: a challenge for smart machines in education. In Smart Machines in Medicine: The Coming Revolution in Educational Technology, ed. K. Forbus and P. Feltovich, 349-376. Menlo Park, California: AAAI Press.

Feltovich, P., R. Hoffman, D. Woods, and A. Roesler. 2004. Keeping it too simple: how the reductive tendency affects cognitive engineering. IEEE Intelligent Systems, May/June 2004: 90-94.

Feltovich, P., R. Spiro, and R. Coulson. 1989. The nature of conceptual understanding in biomedicine: the deep structure of complex ideas and the development of misconceptions. In Cognitive Science in Medicine, ed. D. Evans and V.L. Patel, 113-172. Cambridge, MA: MIT Press.

Goodchild, M. 2005. What does Google Earth mean for the spatial sciences? GIS Ireland Conference proceedings. October 13, 2005. Dublin, Ireland

Quintanar, L.R., C.R.Crowell, and J.B. Pryor. 1982. Human-computer interaction: A preliminary social psychological analysis. Behavior Research Models and Instrumentation 14(2): 210-220.

Russell, S. and P. Norvig. 2003. Artificial Intelligence: a modern approach. Upper Saddle River, NJ: Pearson Education. pp. 1132.

Scheiderman, B. 1998. Designing the user interface: strategies for effective human-computer interaction. Third edition. Reading, MA: Addison-Wesley Longman.

Swartz, L. 2003. Why people hate the paperclip: labels, appearance, behavior and social responses to user interface agents. BS Honors thesis, Stanford University.

Watt, S. 1998. Psychological agents and the new web media. In The Knowledge Web: Learning and Collaborating on the Net, ed. M. Eisenstadt and T. Vincent. London: Kogan Page.

Comments on naive geography, part 1

For Dan Montello's Cognitive Issues in GIScience class here at UCSB, I was asked to write two short essays, "for and against" the use of naive geography in geospatial software design. Normally, these things disappear into an archive on my hard drive, but since virtual globes are referenced a few times, I thought I'd post them.


Comments Supporting Naive Geography
by Alan Glennon

When new users are introduced to GIS for the first time, they are likely to have two questions: what does GIS do; and how do I make it work? After the user has become proficient enough to extract a solution from a GIS, an additional question might be: how reliable is the output? The answer to each of these questions falls largely to design decisions made by software developers. These considerations of functionality, usability, and accuracy play a significant role in whether a GIS will include or exclude certain users.

Toward designing GIS that is “easily accessible to a large range of users,” and, “can be used without major training… to solve day-to-day tasks,” Egenhofer and Mark (1995) propose integrating “naive” or common sense conceptions of geography into GIS design. In order for a GIS to gain acceptance and use, the answers to each of the three new user questions must have intelligible answers. Thus, a major contribution of integrating common sense geographical knowledge into GIS would be to increase lay understanding of functionality, usability, and accuracy. Though all three issues are pertinent to furthering GIS design with “naive” geographic concepts, for this essay, only functionality—reflected by the question, “what does GIS do”—is discussed.

Because new users will either accept or reject technology based on perceived utility, examining functionality appears to be one of the most direct methods for assessing the relevance of the naive geography design philosophy for GIS. The expectation is that companies that use naive geography design will have a larger user base, or, at least, a larger user group testing and experimenting with the software. Sustaining users beyond their initial experimentation would rely on usability, output, and accuracy.

Design Philosophy
The notion of “naive” geography was introduced by GIScience academics; however, GIS software is overwhelmingly designed by the private sector. That the naive geography philosophy has begun to be embraced by designers is reflected in recent remarks by private industry leaders. At the 2006 Annual Meeting of the Association of American Geographers, Tim McGrath, a Microsoft project manager, cited Egenhofer and Mark directly, stating that the Microsoft team was working to design highly accessible software, “by following the notion of naive geography” (McGrath 2006). Similarly, in late 2005, Michael Jones, the Chief Technical Officer of Google Earth, stated that his team “sees an opportunity to foster entry level users through simple viewing and community authoring tools, giving them a path into a realm that has been dominated by very complex and specialized applications.” He goes on to say that the Google Earth design team works to “think like the users,” in order to make a product that “regular people can use” (Jones 2005).

Functionality Documentation
The question, “what does GIS do,” describes the software’s basic functionality, including the mechanisms for spatial data storage, query, and representation. Basic to the notion of including “naive” geography into GIS design, users must be able to understand the technology’s capabilities. Consider the list of GIS functionality provided by the companies ESRI and Google. From their websites, Figures 1 and 2 show a bulleted list of capabilities of the ESRI and Google software (ESRI 2006a; Google 2006). The first three capabilities of ESRI’s ArcInfo include functionality to: “build powerful geoprocessing models,” “perform vector overlay,” and “generate events over features.” Alternatively, the Google Earth software allows users to: “type in an address and zoom right in,” “get driving directions,” and “tilt and rotate the view to see 3D terrain and buildings.”


Although ESRI’s ArcInfo arguably offers more powerful GIS functionality, its words and phrases are highly specialized. For instance, the word geoprocessing cannot be found in a standard 2006 dictionary (Answers.com 2006). An Internet search for the phrase “perform vector overlay” yields only GIS-related links, and the phrase “generate events over features,” yields only the ESRI website. In contrast, from Google’s list, a web search for the phrase, “get driving directions,” returns over five million disparate commercial and noncommercial sources. A web search for the other Google feature phrases yields sites that include news outlets, individuals, schools, and businesses. Most of the sites do not specialize in GIS, but reflect ongoing “lay” discussions of Google Earth. From their engineering remarks and website documentation, Google appears to be embracing a naive geography design philosophy. Conversely, ESRI appears to be following an alternative philosophy highlighting the complexity and powerful functionality of its ArcInfo software.

User Numbers
Exact user numbers generally are guarded by individual companies as proprietary secrets. Nevertheless, companies that have more fully embraced naive design concepts appear to be attracting a much larger user base. For instance, ESRI, a company founded in 1969, has traditionally been the leader in GIS software. On its website, ESRI (2006b) boasts one million users in 200 countries. Crampton (2006) asserts that by making its software much more accessible, Google has effectively staged a coup of ESRI’s GIS dominance. On June 12, 2006, less than a year after its launch, Google announced that their “simple, fun” solution, that “regular people can use” has had 100 million installations. As such, Crampton argues that “…Google Earth has consistently more mindshare than GIS.” Recent developments show that ESRI has begun to recognize the power of naive geography. ESRI claims that its upcoming software offering, ArcGIS Explorer “aims to be a ‘GIS for everyone’,” and “is easy to use and does not require training” (Maguire 2006; ESRI 2006c).

Incorporating common sense conceptions of the geographical world into GIS will make the software more usable, thus adding meaning and value. As multibillion dollar companies like Google and Microsoft formally declare that they are designing spatial software to be understandable and usable for regular users, the impact of the naive geography design philosophy is becoming unmistakable. Egenhofer and Mark’s naive geography goal of making GIS “accessible to a larger range of users” is underway.

References

Answers.com: The American Heritage Dictionary of the English Language, Fourth Edition. 2006. Geoprocessing. http://www.answers.com/topic/geoprocessing. (accessed 3 May 2006).

Crampton, Jeremy. 2006. “Critical GIS: Map Hacks, Mashups, and the Geo-web challenge GIS.” GeoWorld, January 2006.

Egenhofer, M. and D. Mark. 1995. Naive geography. In Spatial Information Theory: a theoretical basis for GIS, volume 988 of Lecture Notes in Computer Science, ed. A. Frank and W. Kuhn, 1-16. Berlin: Springer-Verlag.

ESRI. 2006a. ArcInfo. http://www.esri.com/arcinfo.  (accessed 3 May 2006).

ESRI. 2006b. GIS in our world.   http://www.esri.com/company/about/facts.html. (accessed 3 May 2006).

ESRI. 2006c. ArcGIS Explorer FAQs. http://www.esri.com/software/arcgis/explorer/about/faqs.html. (accessed 3 May 2006).

Google. 2006. Google Earth: 3D interface to the planet. http://earth.google.com. (accessed 3 May 2006).

Jones, Michael T. 2005. Google Earth. Resources from the CEOA Symposium on Science & Technology in Global Earth Observation System of Systems (GEOSS): The Role of Universities, University of California, San Diego, 22 November 2005.

Maguire, David. 2006. ArcGIS Explorer at AAG. http://gismatters.blogspot.com/2006/03/arcgis-explorer-at-aag.html. (accessed 3 May 2006).

McGrath, Tim. 2006. Microsoft MapPoint: The Power of Location. Paper presented at the Association of American Geographers Annual Meeting, Chicago, Illinois, 7-11 March 2006.

Friday, June 16, 2006

NASA World Wind: from visualization to mission operations tool

Last Wednesday, Patrick Hogan, Project Manager of NASA World Wind, spoke at Where 2.0 in San Jose. Hogan's fifteen-minute talk was a straightforward description of the software, including comments on its open-source nature, Earth and planetary visualization functionality, and ongoing data import development. As Hogan spoke, World Wind Designer Randy Kim demonstrated and drove the software. The most newsworthy item was that World Wind has had 20 million downloads; SourceForge numbers for World Wind list over 7.5 million in the past year.

After the talk, I met NASA's Frank Kuehnel, Randy Kim, and Patrick Hogan. During the conversation, I asked about a few details of World Wind's architecture. First, while World Wind previously represented Earth as a sphere, Kuehnel said that the next version, due this fall, will be an ellipsoid. The team also has been working on a more flexible tiling structure, using polyhedral segmentation. World Wind tiles currently are composed of four-sided polygons. A major issue has been that these tiles become pinched near the poles. As the four-sided polygons approach the poles, the tiles effectively become triangles, causing awkward image texture distortions. With the large number of converging polygons, it also means that the geometry for the poles is quite complex. Kuehnel said the complex geometry and distortions are less problematic for Earth, since the poles are sparsely populated, but that they pose a larger problem for other bodies. Undoubtedly, he was referring to the fact that much of science on Mars and other planets involves research near poles. World Wind's upcoming architecture changes will minimize polar complexity and also allow the mapping of nonspherical bodies--like asteroids and comets.

Other news:
  • Also Wednesday at Where 2.0, Mark Lucas talked about OSSIM, a C++ open-source "high performance software system for remote sensing, image processing, geographical information systems and photogrammetry." As his closing slide, Lucas mentioned OSSIM's virtual globe, osgPlanet. Ossim.org has a page describing this virtual globe, including screenshots.
  • As pointed out on Ogle Earth, Skyline Globe is not yet available for download. Both the website and a SkylineGlobe developer said the download will be available "shortly."


Image: A NASA World Wind 1.3.5 screenshot of the moon's southern pole.

Thursday, June 15, 2006

Virtual globes expectations from Where 2.0

Before the conference, I gave four Where 2.0 expectations I had for Google, ESRI, NASA, and Microsoft concerning virtual globes. Here are my post-conference impressions:

Google will talk about their time browser
Google did not launch the time browser I was hoping for, but did introduce an attractive new version of Google Earth. When asked about spatiotemporal data at Geo Developer Day, Michael T. Jones, Google Earth CTO, alluded to additional relevant functionality available within Google Earth Enterprise. He did not linger on the point though, as not to distract from the features of the latest consumer release. Also stated somewhat cryptically, Jones mentioned the risks of adding functionality that detracts from the usability of the product. I interpret this to mean that they have not found a satisfactory manner to implement a time browser that matches their user-to-user design philosophy.

ESRI will either launch or provide an exact launch date for ArcGIS Explorer
ESRI and Jack Dangermond did not provide a launch date for the public beta of ArcGIS Explorer. While disappointed, I am heartened that they are making sure their internet-based virtual globe is fully-baked before release.

NASA; Hope to hear more about their vision of moving World Wind toward a scientific analysis tool
Of the four, my expectations from the NASA World Wind team were lowest. Patrick Hogan's Where 2.0 presentation was entirely about the basic functionality and open-source nature of the software; no particularly new material was covered. However, in a conversation with World Wind developers Randy Kim and Frank Kuehnel, I learned a lot more about the next steps in the software's evolution from visualization software to what they describe as a "mission operation" tool. I'll discuss those details--which mostly concern the software's tiling infrastructure--in a later post.

Microsoft will display or announce some thoughtful, interesting tool -- with a somewhat logical business model
I set expectations low for Microsoft too. Though it's anticipated that Microsoft will eventually launch a virtual globe, I did not expect an announcement. In fact, at this conference they did not launch anything. Their most-recent Windows Live Local was released a few weeks ago though on May 23rd. Its new features portray mostly-incremental, logical progress: better integrated Messenger map sharing, pushpins and notes collections, and the ability to view local traffic conditions. Their release notes provide specifics. Microsoft really seems to believe in their Bird's Eye imagery. Their goal of covering 80% of the United States with Bird's Eye overhead imagery is a big commitment (and good news for Pictometry). I made sure to utter my hope for 3D geospatial software for XBOX360 to every Microsoft employee I saw. Hopefully, someone will carry the message back to the hive.

Common visualizations for Autodesk

In the hallway at Where 2.0, I saw Gary Lang of Autodesk. He is a lead in the Infrastructure Solutions Division. While my prodding did not glean any information about the possibility of Autodesk introducing a Google-Earth-like virtual globe, he did provide the following statement about their numerous three-dimensional and geospatial offerings: "we are working to provide common visualizations across our products."

Wednesday, June 14, 2006

A secret of the Microsoft Live Local Team

While talking to one of the guys from Microsoft Live Local, I learned a little bit about the way they do their internal business. According to the Microsoft rep, the Live Local team works in what he called "100-day sprints." The workgroups are expected to produce a predetermined, measurable result every 100 days. My thoughts are that a natural result for the Live Local Team is updated functionality for their product. So when was the end of the last "100-day sprint?" The rep answered, "May 23rd." Thus, by my calculation, we should expect some new Live Local functionality around August 31st.

More in line with their public announcement, I had the Microsoft guys clarify their goals for their Bird's Eye imagery. Their plan is to have Bird's Eye imagery available for 80% of the United States. When asked about the possible development of a virtual globe, the reps simply reiterated Microsoft's enthusiasm for Bird's Eye imagery and annotation. Fortunately, earlier in the day, Microsoft's Stephen Lawler gave a hint of things to come. Making reference to the fly-through functionality of Google-Earth-like software, and how Live Local does not offer such a 3D experience, he left no doubt that they were working on it. "We're the company that made Halo. The company that made Flight Sim," he said.

KML in Google Maps: one-on-one with the Google Maps Team

I had a nice talk with a developer of the KML support for Google Maps. He said that the dialog window sizing problem is a persistent, known issue, and Google is working to solve it. As a workaround, if you close and reopen any problematic placemark window, the window resizes properly when opened the second time. Concerning the other issues I noted in my previous post, Google spells out what KML features can be handled by Google Maps on their website. I was told to expect some of the issues to be resolved within a month. Overall, they are marching toward 100% KML compatibility.

It appears that the URL for these KML-driven maps follow this format:
http://maps.google.com/maps?f=q&hl=en&q=
http://www.yourdomain.com/yourfile.kml


(concatenate the above two lines as a single long string with no spaces)
Replace www.yourdomain.com/yourfile.kml with the domain and kml you are using. Additional customizations can be created if you follow the pattern in links for satellite imagery and hybrid modes. Their API documentation undoubtedly provides either direct or indirect additional details.

Tuesday, June 13, 2006

Skyline, Metacarta, and other news from Where 2.0

Skyline launched a full-fledged, internet-based virtual globe today at the Where 2.0 Conference. Skyline President Ronnie Yaron test drove the application for me, and it looks promising. The client is about 5MB and can be downloaded at www.skylineglobe.com. As expected, it looks like Google Earth, with various tweaks to differentiate it. I'll post more about the details when I get a chance to play with it.

Most of the interesting stuff I saw in Skyline Globe is in the "Pro" version--which costs about $500. The Pro version includes analytical tools for area, horizontal/terrain length, line of sight, viewshed, and a what appears to be a 3-D buffer tool. Further, the software has its own clock, and allows dynamic data to be represented.

A few other items:

  • Telcontar has renamed itself deCarta.

  • ESRI tells me that they are not necessarily providing an exact launch date for ArcGIS Explorer; however, they did say that Jack Dangermond's presentation on Wednesday would have a surprise/interesting item or two.

  • Metacarta launched several new tools, including an API. See the latest at: labs.metacarta.com. So far at the conference, Metacarta has provided the only talk and announcement that will require me to deeply consider its meaning and impact.

  • The Google team discussed and clarified the new functionality of KML and their new Google Earth release.

Monday, June 12, 2006

Google Earth v4.0 beta, bug report

[update: I have several Ph.D. students checking out my bug report. It's probably just related to the memory cache issue reported at Ogle Earth. A memory issue on my side seems likely since my computer is old and creaky.]


Using Google Earth Pro v4 beta, the software crashes consistently when I try to "Add Polygon." Anyone else having the same problem?


KML in Google Maps: a little rough

Having KML work in Maps is a fine idea, so I thought I'd test it with my KMZ of Chilean geysers. To use the new KML/KMZ functionality for Google Maps, you just type in the URL of the KML or KMZ in the Google Maps Search box. For instance, my geysers database is at: http://www.alanglennon.com/geysermap/chile.kmz

When I try it, I get the following error message at the lower lefthand side of the screen: Parts of http://www.alanglennon.com/... could not be displayed because it is too large.

As such, from my KMZ, only about 50% of the basic data are imported. Much of the window formatting, folders, and image overlays are either discarded or corrupted. I am sure the Google Team is working toward full compatibility.

A few screenshots:


The KMZ in Google Earth. The 70-cm imagery of this isolated Chilean field is wonderful. As a side note, if you search the database and examine Geyser T87 (due to registration issues, look 20 meters west of T87), the new imagery shows it as a white blur. That is T87 erupting. Perhaps the new texture tools will allow me to take my catalog of eruption imagery and apply them to 3D geometry.


The KMZ in Google Maps. Though the imagery is still 15 meters/pixel, the Google team says they are working to make the imagery updates occur simultaneously in Earth and Maps. Icons and window formatting do not survive the Earth-to-Maps transition.

From the Googleplex

Well, after an early morning drive, I made it to the Googleplex in time for Geo Developer Day. After lunch, Google herded us (maybe ~250? people), into an auditorium to show off their new stuff.

Here are the items the Google team mentioned that I found interesting:

  • Google Earth has had 100,000,000 product activations.

  • Thirty thousand have registered to use the Google Maps API.

  • They are going to support Sony COLLADA XML (textures for 3D things).

  • The new release of Google Earth supports larger user imagery. I didn't understand exactly what this meant, but it sounded like the software would take care of some of the tiling/visibility burden.

  • Google Maps can now read KML -- for example, paste an online KML's URL into the Google Map's Search line.

  • As noted by various other bloggers before today, Google updated their imagery database -- Google provided a few new details: Google Earth now has about 20% of the Earth's landmass in 70-cm resolution. Such high-resolution imagery covers approximately 30% of the world's population.

  • One of the developers said that the typical satellite imagery Google uses is accurate to about 10-13 meters.


The other blogs can go into the specifics -- there were a lot of additional points made about versions of Google software for Mac and Linux. Though none of the announcements were particularly revolutionary, it was refreshing to see Google share some of its secrets (particularly the number of users). That small glimpse into Google Earth's inner workings was a welcome step forward. Until now, the Google Earth team has had something of a Willy Wonka's Chocolate Factory vibe.

Sunday, June 11, 2006

Off to Where 2.0

I'm packing clothes and on my way to San Jose and Where 2.0. In terms of virtual globes, the traditional big players will be in attendance: Google, NASA, ESRI, and Skyline. Some Second Life guy(s) are giving a virtual-globesque talk; it'll be interesting to hear their spin.

Lately I have been concentrating on my own virtual globes research, so I haven't thought enough about what to expect from the San Jose shenannigans. Regardless, here are a few off-the-cuff possibilities:

  • Google will talk about their time browser. My expectations are high that they will pull a rabbit out of their hat and really wow me.

  • Since ESRI/Jack Dangermond said ArcGIS Explorer will launch a public beta in June (and the month has less than 20 days left), they should either launch or provide an exact date.

  • I do not expect any surprises from NASA, but hope to hear more about their vision of moving World Wind toward a scientific analysis tool.

  • Microsoft will display or announce some thoughtful, interesting tool -- with a somewhat logical business model.


I'll actually have to think of real expectations and questions on the drive up there. Right now, with ten hours before things get started at the Googleplex, the immediate question is whether I will wake up early enough to drive from Santa Barbara to Mountain View before noon. ~A

Friday, June 02, 2006

Harvard Center for Geographic Analysis

According to the Harvard Center for Geographic Analysis' new website, on May 5, 2006, "Harvard returned to geography." On that date, Harvard had the official opening of its new geographic research center. Among the attending dignitaries, ESRI's Jack Dangermond remarked, "what happens with this center and what starts today will set off shockwaves in the academic world."

The Center's website makes reference to the Harvard's commitment to raise funds for two senior faculty positions, and, the Center's intention to "[add] to the undergraduate and graduate curriculum."

None of this has received all that much press. In fact, a recent websearch for Harvard Geography yielded this blog as the top hit.